

What RF Debug Really Means
RF debug is the systematic process of isolating why a prototype RF board does not meet its performance targets—gain, noise figure, return loss, spurious emissions or output power—and tracing each deviation to a specific root cause in the layout, materials, assembly or schematic. Unlike digital debug, where a signal is either right or wrong, RF debug deals in continuous degradation: a trace 2 mil too narrow shifts impedance by 3–5 Ω, which raises return loss by a few dB, which clips your link budget. The method below compresses the search space into five ordered steps so you spend bench time measuring, not guessing.
Before You Power Up: Preparation

Half of RF debug efficiency comes from what you do before the first measurement. Gather these items:
- Schematic, layout database and Gerber set. You will cross-reference pad dimensions, via counts and copper pours against the physical board. A complete RF PCB documentation package prevents chasing ghosts caused by fab deviations you cannot verify.
- Bill of materials with vendor part numbers. Confirm every passive value, especially matching-network capacitors and inductors whose self-resonant frequency (SRF) must exceed your operating band.
- Simulation data. Export S-parameter touchstone files, gain curves and stability circles from your EDA tool so you can overlay measured data directly.
- Calibrated instruments. At minimum: a VNA calibrated to the cable tips (SOLT or eCal), a spectrum analyzer with a known-good preamplifier, a DC supply with current limiting, and a multimeter.
Step 1 — DC Verification
Why DC Comes First
An active device biased at the wrong quiescent point will never hit its RF specs, no matter how perfect the matching network. Checking DC takes minutes and eliminates the largest class of assembly defects: missing components, solder bridges, wrong-value resistors in bias dividers and shorted decoupling capacitors.
What to Measure
- With the supply off, measure resistance from each power rail to ground. Compare to the expected value from the schematic; a short below 1 Ω usually means a solder bridge or a failed decoupling cap.
- Power up at reduced voltage (70–80 % of nominal) with current limiting set 20 % above the expected quiescent draw. Watch the current settle; a slow ramp that stabilizes is normal for devices with internal regulators, while a current that climbs steadily signals oscillation or latch-up.
- Probe every bias node—gate/base voltage, drain/collector voltage, LDO outputs—and compare to datasheet typical values. A drain voltage 0.5 V low on a GaAs pHEMT, for example, often points to a gate-resistor value error or a missing pull-down.
Common DC Faults in RF Boards
- Reversed polarity on a PIN-diode switch bias line.
- Wrong inductor used as an RF choke, saturating at the DC current and dropping voltage.
- Thermal pad not soldered on QFN amplifiers, causing thermal runaway under bias.
Step 2 — Small-Signal S-Parameter Sweep
Once DC checks pass, connect the VNA. A two-port S-parameter sweep from well below to well above the operating band reveals impedance mismatches, unexpected resonances and gain-slope problems in a single capture.
Procedure
- Calibrate at the board edge. If your board uses SMA connectors, calibrate at the SMA reference plane. For boards with U.FL or MMCX, use adapter-removal or port extension to de-embed the connector.
- Measure S11 and S22 first. Plot on a Smith chart. A well-matched port should cluster near 50 Ω at the center; a loop that swings to the edge of the chart at a frequency inside your band indicates a matching-network fault. Compare the loop shape to simulation—if the loop is rotated but the same diameter, the likely cause is excess transmission-line length (layout routing error). If the diameter has changed, a component value is wrong.
- Measure S21 (gain or insertion loss). Look for the expected passband shape. A dip at a specific frequency usually means a series resonance in a DC-blocking cap or a parallel resonance in a bias choke. Record the 3-dB bandwidth and compare to simulation.
- Check S12 (reverse isolation). Poor isolation (less than 15–20 dB on an amplifier stage) at a frequency where the device has gain is a classic indicator of feedback oscillation risk, often caused by inadequate ground-via stitching around the active device.
When the matching network uses quarter-wave stubs or transformer sections, the impedance is sensitive to the laminate’s actual dielectric constant. If your measured S11 minimum shifts in frequency by more than 2–3 %, verify the Dk of your high-frequency laminate against the vendor datasheet at your operating frequency—Dk can drift 1–3 % between the 1 GHz catalog value and the actual value at 10 GHz or above.
Step 3 — Spectrum Analysis
The VNA tells you about the linear network; the spectrum analyzer tells you what the circuit is actually generating. Power up the DUT in its intended operating mode and look at the output spectrum. For a deeper treatment of instrument setup, see our guide to spectrum analyzer basics for RF board debug.
Key Observations
- Fundamental power level. If output power is 3–6 dB below expectation with correct bias, suspect a matching-network loss or a component SRF issue.
- Harmonics. Second and third harmonics more than a few dB above simulation suggest the device is being driven into compression earlier than expected, or that a harmonic trap is detuned.
- Spurious signals. Spurs not related to harmonics of the LO or RF signal often come from oscillation. Sweep the span from DC to at least the third harmonic. A common hiding spot for parasitic oscillations is 50–200 MHz below the operating band, where package parasitics and PCB stubs form an unintended feedback path. These low-frequency oscillations can modulate the wanted signal and appear as close-in phase-noise skirts.
- Noise floor shape. A raised noise floor across a wide band around the carrier can indicate instability or poor grounding in the LNA or driver stage.
Step 4 — Time-Domain and TDR Checks
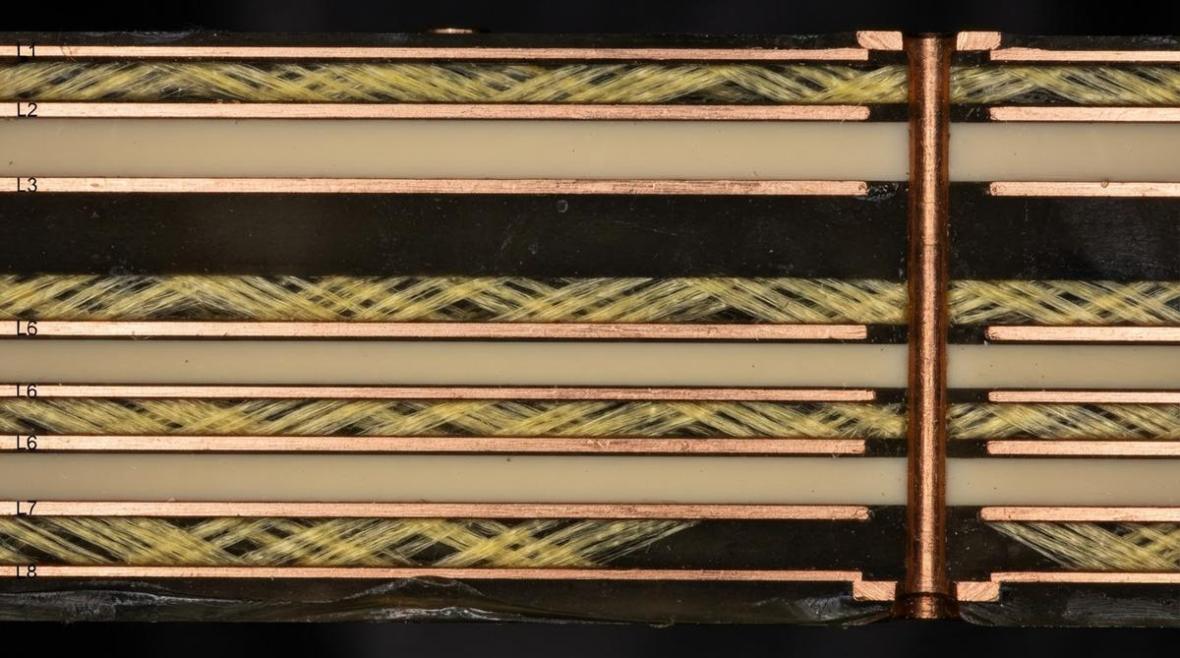
Time-domain reflectometry (TDR), available on many modern VNAs as an inverse-FFT mode, lets you locate impedance discontinuities along a trace to a spatial resolution of roughly 1–2 mm at 20 GHz bandwidth. Walk the TDR cursor along the trace from connector to device pad:
- A step up in impedance at a via transition means the via anti-pad is too large or ground vias are too far away. Adding stitching vias within λ/20 of the signal via usually fixes this.
- A step down at a pad often means the pad is wider than the trace, creating a capacitive discontinuity. Adjusting the pad-entry taper in the next layout spin resolves it.
- A ringing pattern that does not damp within 3–4 reflections indicates a resonant cavity, possibly between two ground planes with insufficient via stitching.
TDR is also invaluable for catching fabrication defects. If the characteristic impedance of a 50 Ω microstrip reads 55–58 Ω across the entire board, the dielectric thickness or trace width from the fab is off-spec—an issue covered in detail in our RF PCB failure analysis guide.
Step 5 — Radiated Emission and Isolation Scan
Even when conducted performance meets spec, radiated emissions can fail regulatory limits or cause self-interference between sections of a multi-function board. Use a near-field probe set (H-field loop and E-field monopole) connected to the spectrum analyzer to scan the board surface.
What to Look For
- Hot spots on clock lines or digital buses. A digital switching noise source coupling into an adjacent RF receive path is the most common inter-domain interference. Differences between high-frequency and high-speed design disciplines often surface here.
- Leakage around shielding cans. If a shield can has a slot or gap wider than λ/20 at the highest frequency of concern, it radiates. Probe along the can perimeter to find the leak.
- Cable and connector radiation. Flex cables and unshielded headers act as antennas. If the emission disappears when you disconnect a cable, the fix is filtering or shielding at the connector, not on the board.
For boards that must pass FCC or CE pre-compliance, a more detailed workflow is described in our radiated emission debug article, including correlating near-field scans to far-field chamber results.
After the Five Steps: Decision Matrix
Once all five steps are complete, you have a ranked list of deviations. Use this decision matrix to decide what to fix and how:
| Deviation Type | Fix on Current Board? | Requires Respin? |
|---|---|---|
| Wrong passive value | Yes — swap component | No |
| Matching network detuned by ≤ 5 % | Yes — adjust L/C values | No |
| Trace impedance off by > 5 Ω | Partial — add shunt stub or series cap | Usually yes |
| Parasitic oscillation from layout feedback | Sometimes — add resistive loading or ferrite | Often yes |
| Ground-plane slot or split causing radiation | No | Yes |
| Laminate Dk mismatch shifting filter response | No (component tuning may partially compensate) | Yes, or change material |
Before committing to a respin, verify that your fabrication process can hold the tolerances your fix requires. Reviewing RF PCB manufacturing process steps helps you specify the right tolerance class and avoid repeating the same deviation.
Debug Checklist (Print and Pin to the Bench)
- DC rail resistance to ground — expected vs. measured.
- Quiescent bias currents and voltages — all active devices.
- S11/S22 Smith chart overlay — measured vs. simulated.
- S21 gain/loss and bandwidth — within ± 1 dB?
- Spectrum: fundamental power, harmonics, spurs, noise floor.
- TDR impedance profile — discontinuities located and sized.
- Near-field scan — hot spots identified and correlated to layout features.
- Root-cause list ranked by severity.
- Fix plan: component swap, rework or respin.
Frequently Asked Questions
What is the most common root cause found during RF debug?
Impedance mismatch due to incorrect trace width or dielectric thickness is the single most frequent issue, accounting for a large share of first-prototype failures. It shows up immediately in Step 2 as a shifted S11 minimum.
Can I debug an RF board without a VNA?
You can catch gross faults with a spectrum analyzer and a signal generator using scalar return-loss bridges, but you lose phase information and Smith-chart visualization. For anything above 1 GHz, a VNA is effectively mandatory for efficient debug.
How do I tell the difference between a layout problem and a component problem?
Swap the suspect component with a known-good part of the same value. If the deviation remains, the cause is in the layout (trace geometry, via transition, ground pour). If it shifts, the component was at fault—wrong value, counterfeit or damaged by reflow.
When should I involve failure analysis instead of continuing bench debug?
If you have eliminated component and layout errors but performance still deviates, the problem may be in the fabrication—etching tolerances, plating thickness or laminate properties. Cross-sectioning and IPC-A-600 microsection criteria can reveal what bench instruments cannot.
Does surface finish affect RF debug results?
Yes. ENIG finish adds a 1–5 µm nickel barrier layer that increases insertion loss above 10 GHz by 0.1–0.3 dB/cm. If your measured S21 loss is consistently higher than simulation across the whole band, surface-finish loss is a likely contributor. Immersion silver or OSP avoids the nickel layer entirely. Rogers RO4350B datasheets, for example, specify loss tangent on bare copper—your board’s finish adds to that baseline.
Ready for a quotation?
Send your requirements for a material, stackup and manufacturing review. Price and schedule are confirmed for your project.